To enterresources in your schedule, the best option is to enter the information in the resource sheet.
[divider]
[action_call text=”Microsoft Project Introduction Course” button_url=”https://members.ms-project-elearning.com/vsl-order-form” button_text=”Purchase Now for only 0.99 USD”]
[divider]
The resource sheet
The resource sheet is one of the views that are organized around resource information. All (resource) views are easiest found by right-mouse-clicking the vertical grey bar left of your screen (see video).
Resource information
You can use the resource sheet to manuallyenter required resourceinformation like, among others:
Resource name
Max Unit percentage
Calendar
It’s your turn
Try it out yourself and share your experiences in the comments below!
There are several ways to solve resource overallocation in MS Project (those resource has more work than its availability). Although many MS Project users are hesitant when it comes to using the leveling functionality to solve overallocation, it is possible to do this in a truly controlled manner.
[divider]
[action_call text=”Microsoft Project Introduction Course” button_url=”https://members.ms-project-elearning.com/vsl-order-form” button_text=”Purchase Now for only 0.99 USD”]
[divider]
With the option we discuss here, you have most control over how the tasks will be ordered.
Notice the tasks with the ‘red puppet’:
Hover on the red puppet for the task with the least priority (the least critical task)
Right-click > Reschedule to available date
Check to see that the task has now moved to the first location where the resource has availability
Note that this also induces leveling delay for the moved task
Be in control
The benefit of solving overallocation this way is that you are completely in control of what happens.
Another option
It is also possible to level a selection of tasks all at once:
Select the tasks you want to level
In tab Resource, click Level Selection
Only the tasks you have selected will be considered for delaying by MS Project. The other tasks remain untouched.
Are you confident?
How confident are in solving overallocations in MS Project with the technique we have just discussed?
Share it in the comments below.
[divider]
[action_call text=”Microsoft Project Introduction Course” button_url=”https://members.ms-project-elearning.com/vsl-order-form” button_text=”Purchase Now for only 0.99 USD”]
Before you start loading your schedule with resources, it is important that you know what MS Project will do for you from the moment that they are part of the equation. A good preparation before resource loading is crucial!
[divider]
[action_call text=”Microsoft Project Introduction Course” button_url=”https://members.ms-project-elearning.com/vsl-order-form” button_text=”Purchase Now for only 0.99 USD”]
[divider]
First things first
You first need to identify the tasks in your schedule with fixed work/duration/units and set these accordingly. MS Project calculates with the so-called ‘iron formula’, where the fields work, duration and assignment units calculate each other, based on which of the fields MS Project should not touch.
For instance, traveling with one ship from England to New York takes one week. If you travel with 7 ships (units), should the duration of the trip then be calculated to one day? No, exactly!
It is advised to use baseline 10 before assigning the resources, so you can easily spot any changes that are caused by the resources’ availability.
Task types
Which task type do you use in your schedule and why?
1) Fixed duration
2) Fixed units
3) Fixed work
Share the number and reason in the comments below.
[divider]
[action_call text=”Microsoft Project Introduction Course” button_url=”https://members.ms-project-elearning.com/vsl-order-form” button_text=”Purchase Now for only 0.99 USD”]
Analyzing variances of task and resource costs in MS Project
With the reportCost Overruns (tab reports > custom > cost overruns) you can easily see the changes (compared to the baseline) and which tasks or resources became more expensive or cheaper.
[divider]
[action_call text=”Microsoft Project Introduction Course” button_url=”https://members.ms-project-elearning.com/vsl-order-form” button_text=”Purchase Now for only 0.99 USD”]
[divider]
The task cost variance chart
The report contains two charts and two tables. The Task Cost Variance chart is a line chart that shows the cost variance for every top-level tasks of your project. Directly below the chart you see a table with the % complete and current cost data for the same top-level tasks as in the chart. The chart is a great visualization of the table below; it’s clearly visible that the task ‘preparation’ costs less than baselined (-$998).
The resource cost variance chart
The Resource Cost Variance chart is a bar chart that shows the Cost Variance for every work and cost resource in your project. (Cost Variance = Cost – Baseline Cost). You easily spot here that (work) resource Edwin is a little over $300.- cheaper than baselined. In the table directly below you can see the Cost, Baseline Cost and Cost Variance for every work resource.
What’s your opinion
What do you think of the cost management functionality in MS Project 2013/2016?
Share your opinion in the comments below.
[divider]
[action_call text=”Microsoft Project Introduction Course” button_url=”https://members.ms-project-elearning.com/vsl-order-form” button_text=”Purchase Now for only 0.99 USD”]
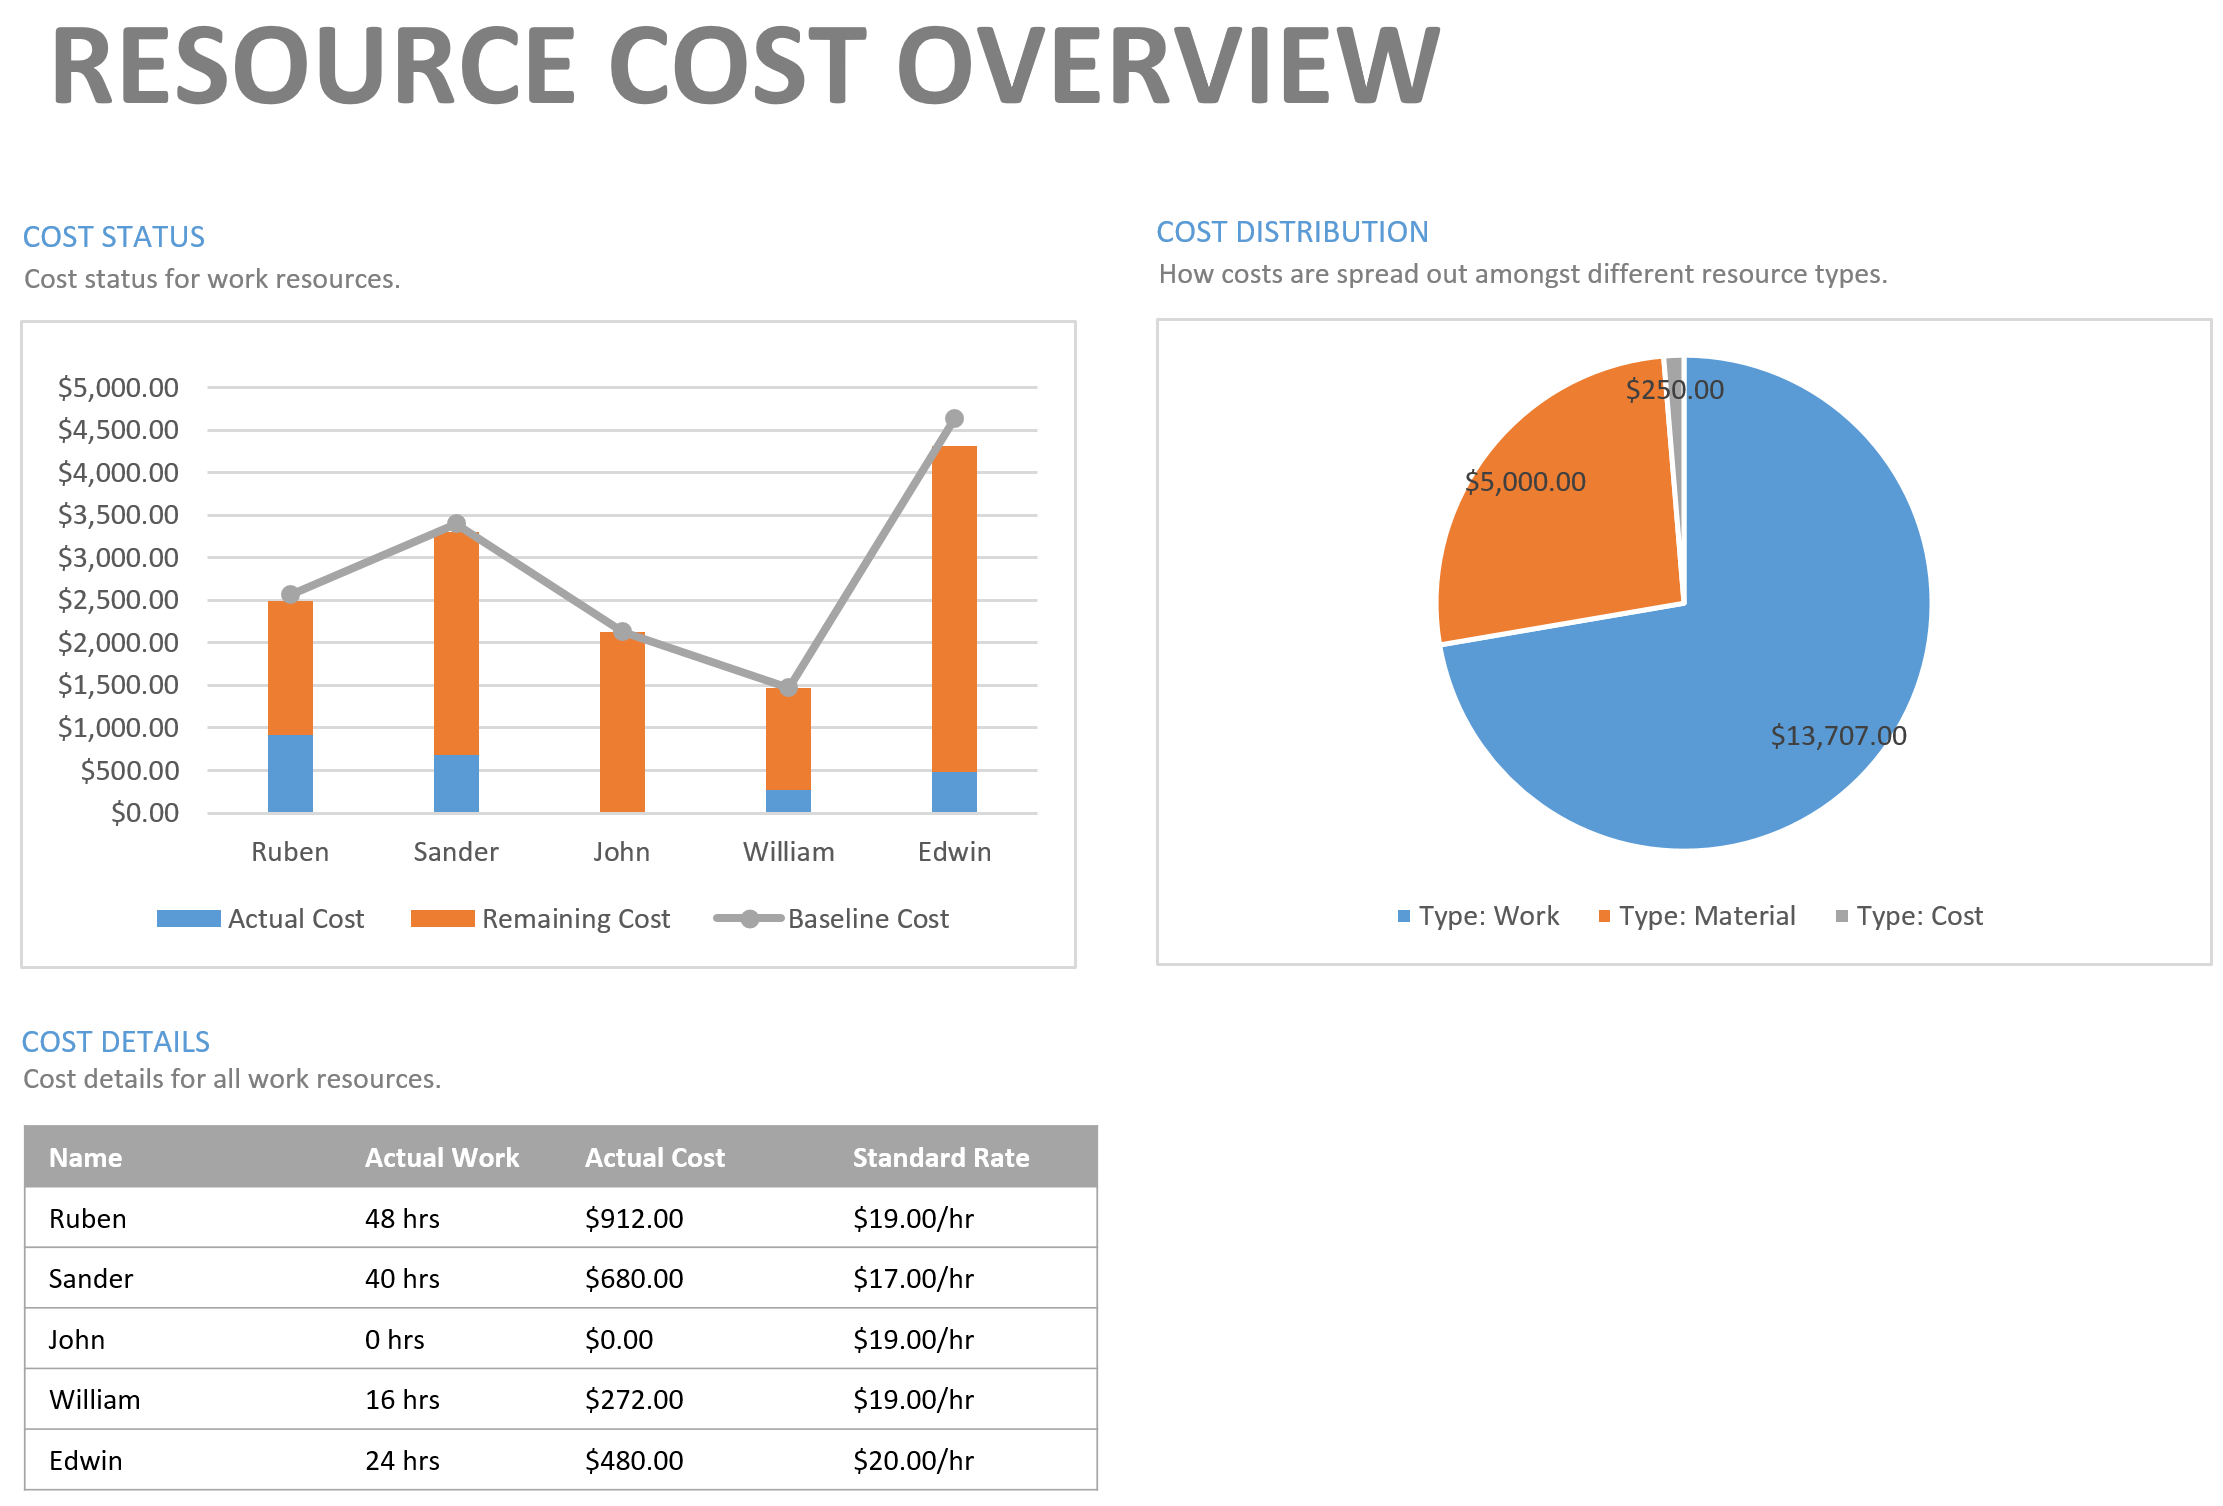
The standard reports ‘Resource Cost Overview‘ and ‘Task Cost Overview’ provide useful graphs and a clear overview of the costs of the work in progress.
[divider]
[action_call text=”Microsoft Project Introduction Course” button_url=”https://members.ms-project-elearning.com/vsl-order-form” button_text=”Purchase Now for only 0.99 USD”]
[divider]
To open the reports click:
Tab ‘Report’
Select from the dropdown menu ‘Costs’
Resource Cost Overview & Task Cost Overview
3 areas with information about the cost of resources in your project
The Cost Status chart is a combination chart that displays the Actual Cost and Remaining Cost per (work) resource in stacked columns, as well as a line for Baseline Cost. You can see in the example that the resource Edwin is expected to cost the most, but that he costs less than the baseline cost. The reason for this could be a lower rate, less hours or a combination of both.
The Cost Distribution pie-chart shows how cost are spread out amongst different resource types (work, material, cost).
The Cost Details table shows for each (work) resource in your project team the Actual Work, Actual Cost and Standard Rate (Actual Cost = Actual Work x Standard Rate).
The Task Cost Overview also shows 3 areas
This time with information about the cost of tasks in your project:
The Cost Status chart is a combination chart that shows the Actual Cost and Remaining Cost in stacked columns for each top-level task as well as a line for Baseline Cost.
The Cost Distribution chart shows how costs are spread out amongst tasks based on the Status field: complete, on schedule, late and future task.
Complete: The task is 100 percent complete
Future task: Start date is greater than the Status Date
On Schedule: The timephased cumulative percent complete is spread to at least the day before the Status Date
Late task: The timephased cumulative percent complete does not reach midnight on the day before the Status Date
In the example you can see that the biggest chunk of costs is for future tasks.
The Cost Details table shows for each top-level task of your project the Fixed Cost, Actual Cost, Remaining Cost, Cost, Baseline Cost and Cost Variance (Cost = Actual Cost + Remaining Cost; Cost Variance = Cost – Baseline Cost). Also in this table you can cleary see that the final assembly costs $200.- more than baselined.
Standard cost reports in MS Project
We are very enthusiastic about these standard reports in MS Project; what about you?
Leave it in the comments below.
[divider]
[action_call text=”Microsoft Project Introduction Course” button_url=”https://members.ms-project-elearning.com/vsl-order-form” button_text=”Purchase Now for only 0.99 USD”]
Why is MS Project limited in displaying the resource critical path?
Possibly you have already realized that after adding resources, the Critical Path will not show as neatly as you might have hoped. Formatting the Critical Path to appear in red will often lead to a broken, fragmented Critical Path.
In MS Project, Task 1 and Task 2 are not considered Critical, or driving predecessors.
[divider]
[action_call text=”Microsoft Project Introduction Course” button_url=”https://members.ms-project-elearning.com/vsl-order-form” button_text=”Purchase Now for only 0.99 USD”]
[divider]
Why? And what now?
The reason for this is that Microsoft Project treats tasks as critical when their Total Slack (buffer) is zero or less. When you use features like calendars and hard dates in Microsoft Project, many tasks will have some Total Slack, which breaks the Critical Path. Only by using an add-in, such as the one we recommend (PathsPro), you will be able to find the complete Critical Path.
The PathsPro add-on
With the PathsPro add-on, these will be flagged as being critical.
Answers to all of the following questions with the add-on:
All tasks in my schedule are critical! If you have challenging deadlines, all tasks in your schedule may turn red. Where should I start optimizing?
What is my most-Critical Path?
I don’t understand my Critical Path! Why is this task on the Critical Path?
Why is there a gap between critical tasks? It will show where weekends or holidays explain gaps between critical tasks.
Why is this critical task so long? It will show where resource vacations stretch the durations of critical task bars.
My Critical Path has huge gaps! Why does the Critical Path in my schedule only explain parts of the project duration? It will show if a task is driven by a resource dependency.
Why do I not see a complete Critical Path that explains the entire project duration? Commonly used features (like hard dates, task/resource/project calendars and elapsed durations/lags) can cause these gaps.
I leveled the workloads and now my Critical Path is broken! Do you have unlimited resources? Anybody? If you work with people who are not always available when you need them, you are in a resource-constrained project. When resources get overloaded and you level their workloads, the Critical Path will have huge gaps and explain only parts of the project duration. The add-in will display the Complete Critical Path in your schedule, also known as the Resource-Critical Path that explains your entire project duration.
I cannot find the Critical Path across my subprojects! You have created links between projects and now you want to find the Critical Path to a major milestone in your large program schedule.
In MS Project without add-on it is difficult to explain gaps on the Critical Path:
With the PathsPro add-on, each gap is explained. This will seriously increase the level of understanding for a (delayed) schedule.
Conclusion
Reading the above you might come to the same conclusion as we did: if you are serious about managing a project, you cannot live without the insights that can only be delivered when using this add-on.
Share your thoughts about the add-on in the comments below!
[divider]
[action_call text=”Microsoft Project Introduction Course” button_url=”https://members.ms-project-elearning.com/vsl-order-form” button_text=”Purchase Now for only 0.99 USD”]
Resource Usage is one of the assignment views, just like the view Task Usage. These views are basically the same, as they show e.g. hours/remaining availability per day per assignment.
[divider]
[action_call text=”Microsoft Project Introduction Course” button_url=”https://members.ms-project-elearning.com/vsl-order-form” button_text=”Purchase Now for only 0.99 USD”]
[divider]
When to use the resource usage and the task usage views?
Use these views if you need to deviate from the default 100% on assignment units. For instance if you want people to work 50% of their time to one task and 50% on another task.
Also use this view if you want to learn more about the assignment, like the work contour, assignment units or peak units.
Good to know
Note that if you change the timescale of this view to for instance months, you get a pretty good overview of the amount of hours you have already scheduled. By right-mouse-click > overallocation or remaining availability, you see how you are doing compared to your resource availability.
The difference between Max Units, Assignment units and Peak units?
Units are not covered by a single field in MS Project. The following bullet points describe the meaning of the individual fields. Read them carefully because, for novice users, mixing up these fields is one of the main reasons MS Project gets its reputation for being unpredictable.
Max units (resource field, to be entered in resource sheet)
Units (assignment field that appears as assignment units in the usage views and is used in the iron formula)
Peak (assignment field and resource field, indicating the highest % possible to use this resource (on this task)
[divider]
[action_call text=”Microsoft Project Introduction Course” button_url=”https://members.ms-project-elearning.com/vsl-order-form” button_text=”Purchase Now for only 0.99 USD”]
[divider]
The differences can best be explained by using the following example (Task Usage view):
Task 1: John is assigned for 100%, for this we used the Assignment units field.
Peak units is calculated, it shows the percentage for the highest (peak) within this assignment. Peak usually follows the assignment units.
Task 2: William is assigned for 50%, for this we used the Assignment units field.
Peak units is calculated, it shows the percentage for the highest (peak) within this assignment. Peak usually follows the assignment units.
Task 3: Edwin is assigned, also for 50% using the Assignment units field.
We entered 8 hours on Wednesday, which resulted in peak of 100%.
Task 4: Sander is assigned for 100%. But he will work overtime on the last three days.
Peak was calculated to be 125%. Peak shows the highest day assignment. You also see over allocation (red puppet in Indicator column) because Sander is working more than his usual 8 hours per day. You may ignore this. You allowed him to work overtime when you entered in the 10 hrs of work for these days.
Task 5: Ruben is assigned for 125%. This work needs to be completed in one day.
This is the percentage you see next to the name (in the Gantt chart), as a result of the calculation of 10 hrs work on a one-day fixed duration task. This means overtime. This also gives an over allocation you can ignore.
Good to know
When the assignment units % is different than 100%, you can see the relevant percentage next to the resource name in the Gantt chart.
[divider]
[action_call text=”Microsoft Project Introduction Course” button_url=”https://members.ms-project-elearning.com/vsl-order-form” button_text=”Purchase Now for only 0.99 USD”]
Next to the regular scheduling options (constraints, dependencies) and the leveling algorithm, it is important to discuss the resource leveling options. What are the ideal setting for the leveling options screen?
[divider]
[action_call text=”Microsoft Project Introduction Course” button_url=”https://members.ms-project-elearning.com/vsl-order-form” button_text=”Purchase Now for only 0.99 USD”]
[divider]
Resource Leveling options
The resource leveling options can be found by clicking Resource tab > Leveling Options:
Automatic vs Manual – Choosing ‘automatic’ will calculate and level your schedule automatically each time something changes. When choosing ‘manual’ you need to click the level resources button.
Day by Day, Week by Week, etc. – Determines when the red puppet will appear. Day by day basis means that puppets will be red at more than 8 hours on a day. Week by week more than 40 hours in a week, etc.
Clear leveling values before leveling – Having this option on makes sure each leveling action uses a new start, instead of continuing on top of the already leveled tasks.
Leveling order – Choosing ‘ID’, it will only use the location in the schedule to determine which task goes first. Choosing ‘standard’ will use the algorithm logic as explained in the previous paragraph and weighs in the priority field for the leveling score. Choosing ‘priority, standard’ means that the priority will always preceed the factors of the standard algorithm.
Level only within available slack – Having this option on will not increase the duration of your schedule. This also means that it will only solve the overallocation up to the point that there is available slack.
Leveling can adjust individual assignments on a task – Having this option on allows that resources could start on a task when they are available. This means that tasks which are scheduled to start at the same time could start at a different moments depending on the resource availability. Additionally, if you have more than one resource assigned to a task, this allows one person to already start and another person to join when available.
Leveling can create splits in remaining work – Tasks are allowed to split for another task or meeting and resume at a later moment. Without this option ticked, a 10 day task would be planned when there is a 10 day gap in the availability of the resource. With this option ticked, it will split the work over shorter periods of availability. This means that this option ticked will create much shorter lead times for the schedule.
Level resources with the proposed booking type – MS Project has the ability to indicate whether an assignment is only proposed or definitively booked. Default is always definitively booked. This option will have no consequences for you, if you did not change the booking type of the resource.
Level manually scheduled tasks – Manually scheduled tasks are not moved by MS Project. With this option you can have MS Project level these tasks as well.
Personal settings
These settings are personal, so you can choose to deviate from the default settings where you prefer. In this image you see our preferred settings.
The settings can also be applied on a task level, by inserting the column with these names in your view.
What are your preferred and personal setting in the resource leveling screen? Share it in the comments below.
[divider]
[action_call text=”Microsoft Project Introduction Course” button_url=”https://members.ms-project-elearning.com/vsl-order-form” button_text=”Purchase Now for only 0.99 USD”]
Do you ask yourself how you can see if leveling resource has impacted your schedule? You can be certain that it will have consequences for your schedule, for instance your plan date(s) could now be scheduled later.
[divider]
[action_call text=”Microsoft Project Introduction Course” button_url=”https://members.ms-project-elearning.com/vsl-order-form” button_text=”Purchase Now for only 0.99 USD”]
[divider]
What to do before leveling resources?
We advise to set a baselinebeforeyou start leveling resources (use ‘Baseline 10’ for instance) to learn the impact to your schedule and how to optimize it further.
When you set the baseline, you now can add the column Finish Variance to your view, like in the image below:
In the Gantt chart of this view you see the FinishVariance displayed next to each task. This represents the delay caused by factoring in the influence of your resources availability.
To learn more about resourceoverallocation, make sure you also read this blog post!