Analyzing variances of task and resource costs in MS Project
Share
Analyzing variances of task and resource costs in MS Project
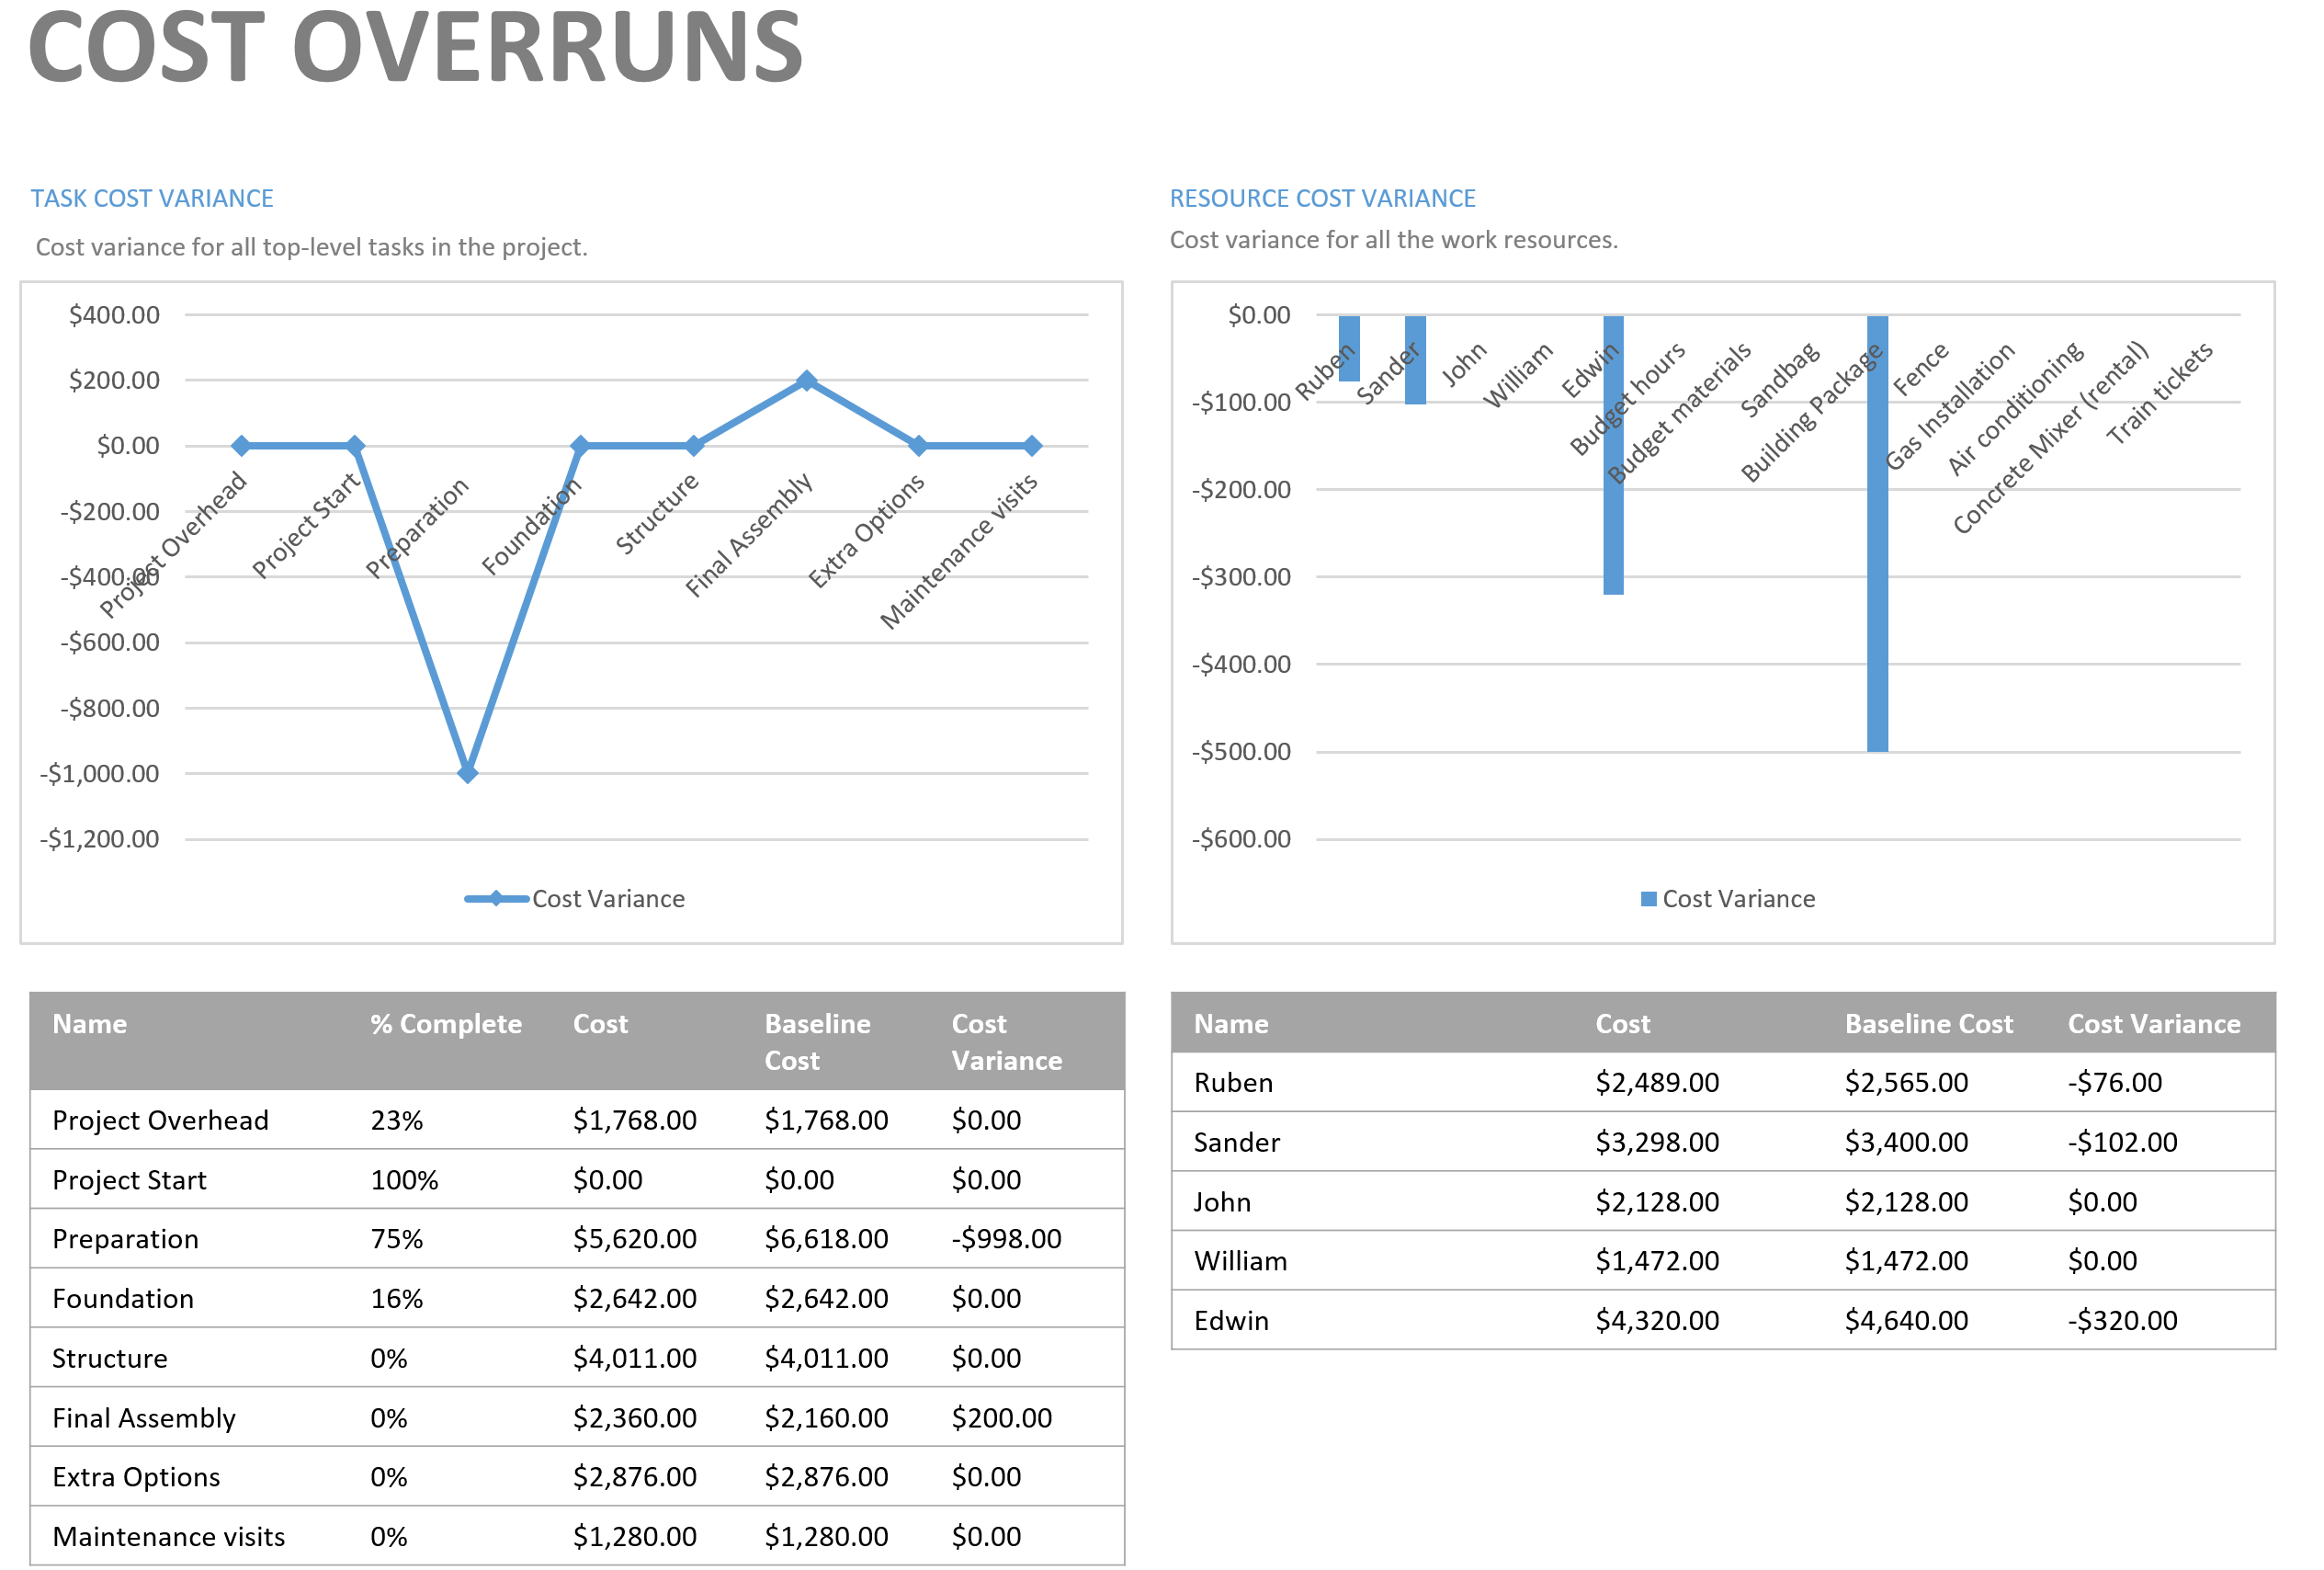
With the reportCost Overruns (tab reports > custom > cost overruns) you can easily see the changes (compared to the baseline) and which tasks or resources became more expensive or cheaper.
The task cost variance chart
The report contains two charts and two tables. The Task Cost Variance chart is a line chart that shows the cost variance for every top-level tasks of your project. Directly below the chart you see a table with the % complete and current cost data for the same top-level tasks as in the chart. The chart is a great visualization of the table below; it's clearly visible that the task 'preparation' costs less than baselined (-$998).
The resource cost variance chart
The Resource Cost Variance chart is a bar chart that shows the Cost Variance for every work and cost resource in your project. (Cost Variance = Cost - Baseline Cost). You easily spot here that (work) resource Edwin is a little over $300.- cheaper than baselined. In the table directly below you can see the Cost, Baseline Cost and Cost Variance for every work resource.
What's your opinion
What do you think of the cost management functionality in MS Project 2013/2016?
Share your opinion in the comments below.