The standard reports 'Resource Cost Overview' and 'Task Cost Overview' provide useful graphs and a clear overview of the costs of the work in progress.
To open the reports click:
- Tab 'Report'
- Select from the dropdown menu 'Costs'
- Resource Cost Overview & Task Cost Overview
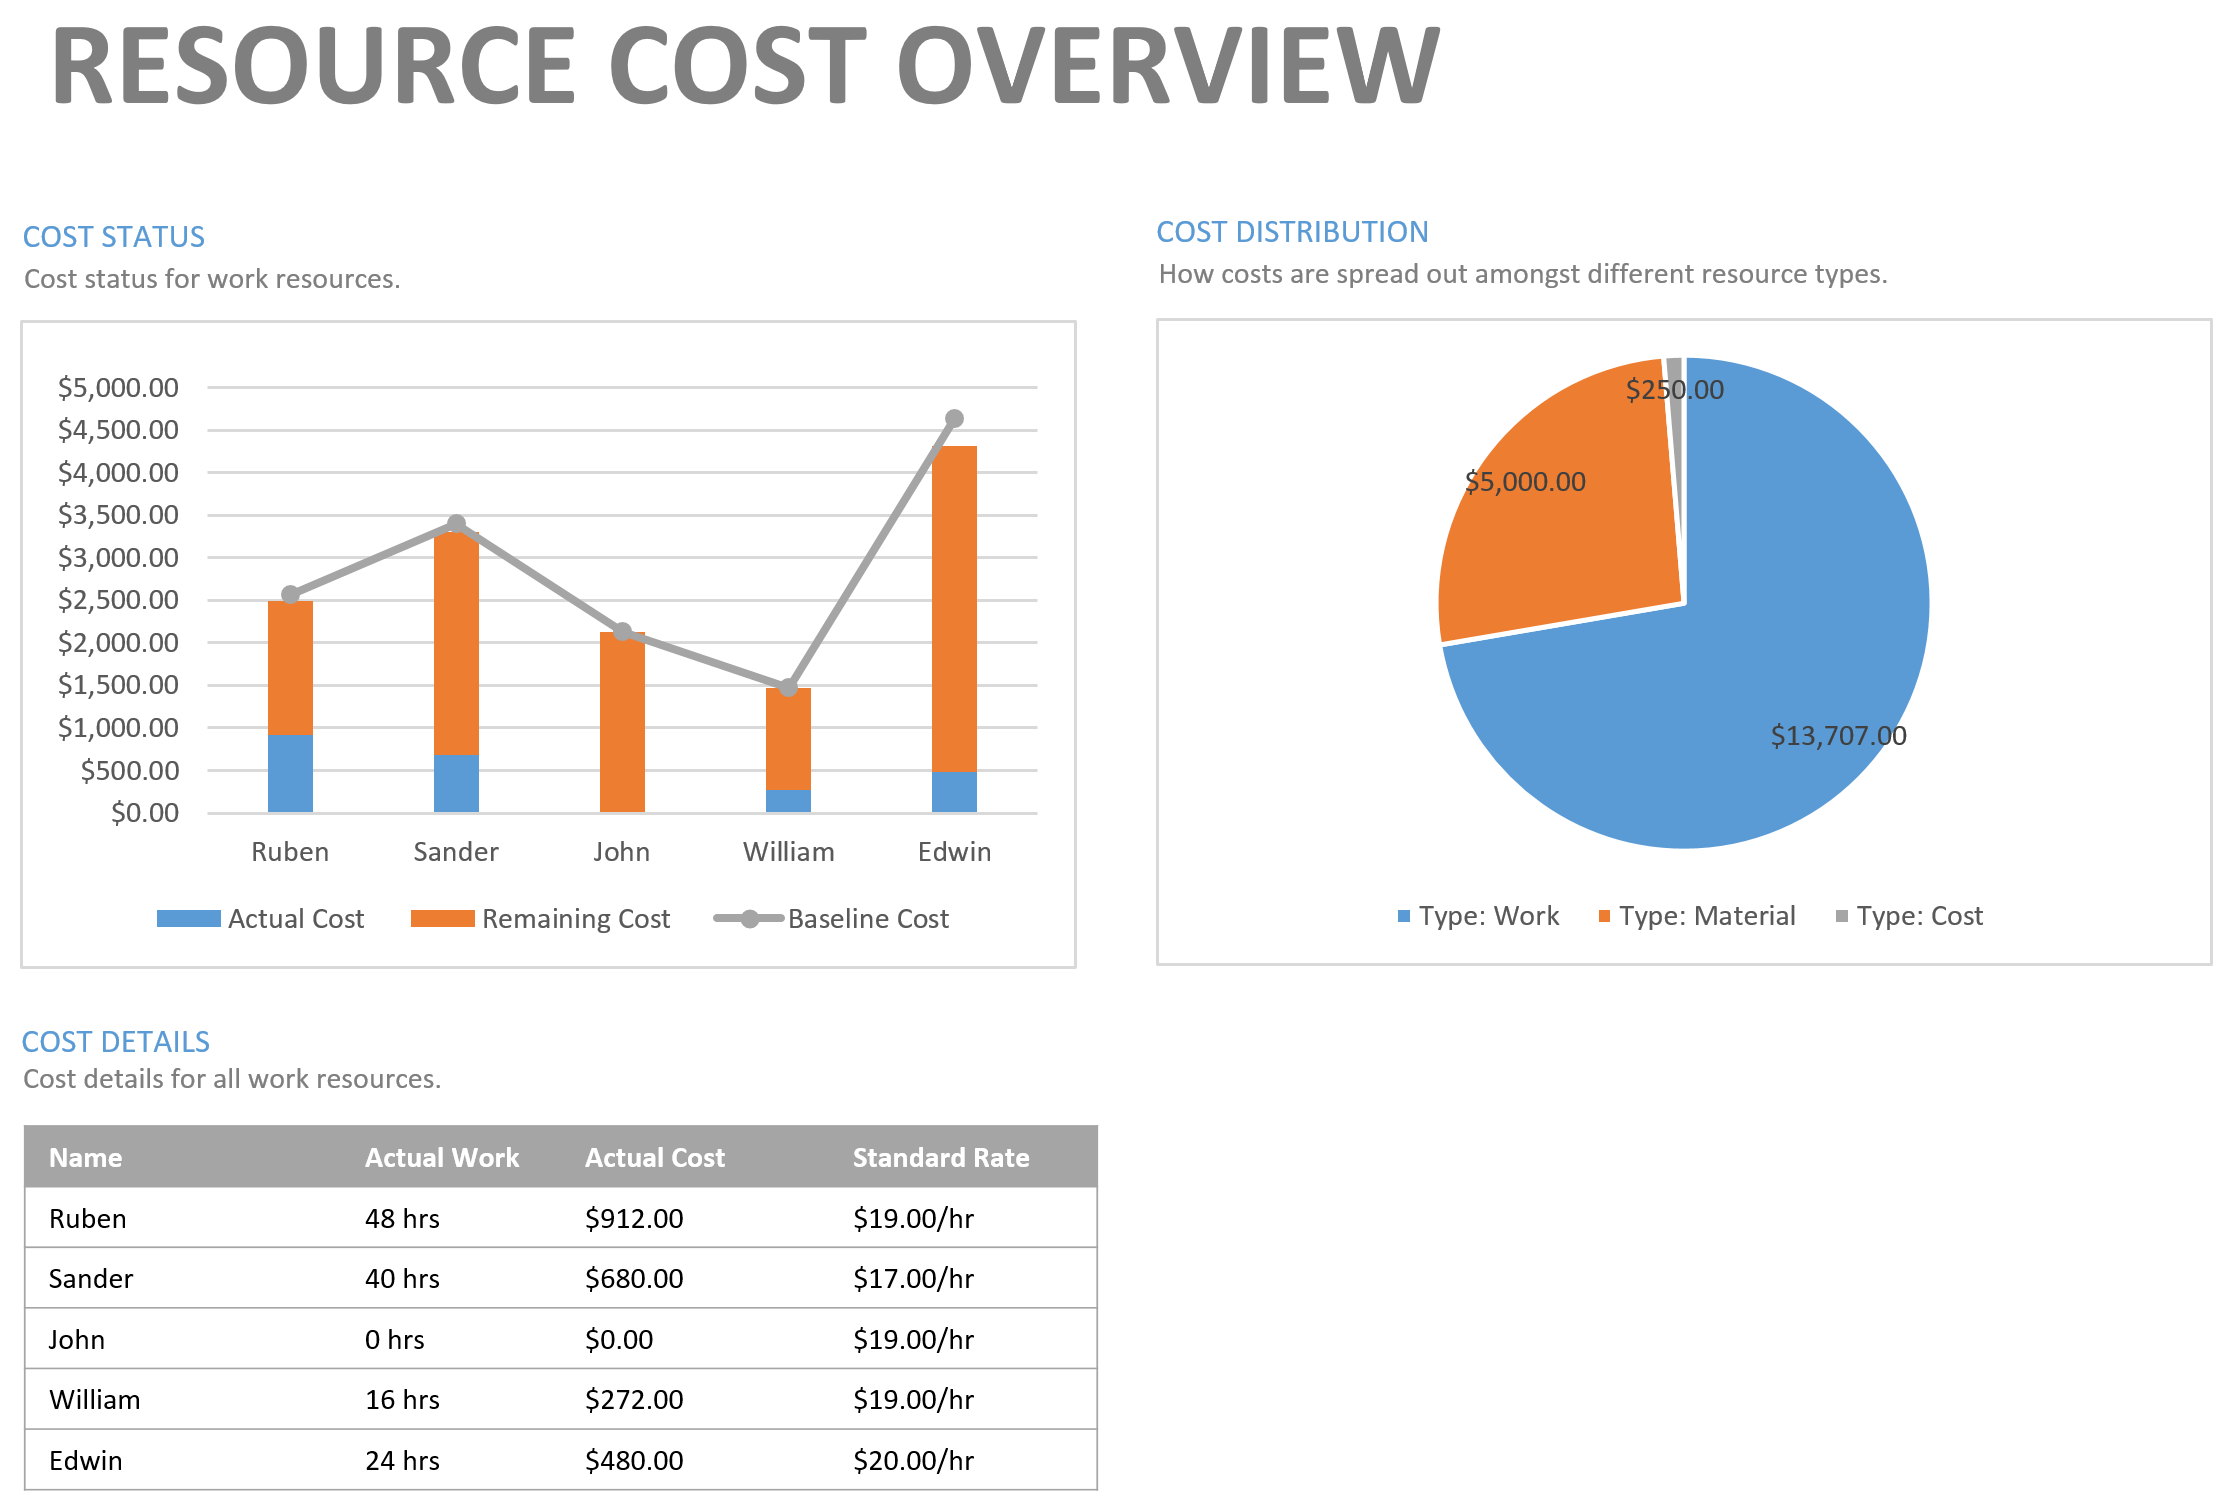
3 areas with information about the cost of resources in your project
The Cost Status chart is a combination chart that displays the Actual Cost and Remaining Cost per (work) resource in stacked columns, as well as a line for Baseline Cost. You can see in the example that the resource Edwin is expected to cost the most, but that he costs less than the baseline cost. The reason for this could be a lower rate, less hours or a combination of both.
The Cost Distribution pie-chart shows how cost are spread out amongst different resource types (work, material, cost).
The Cost Details table shows for each (work) resource in your project team the Actual Work, Actual Cost and Standard Rate (Actual Cost = Actual Work x Standard Rate).
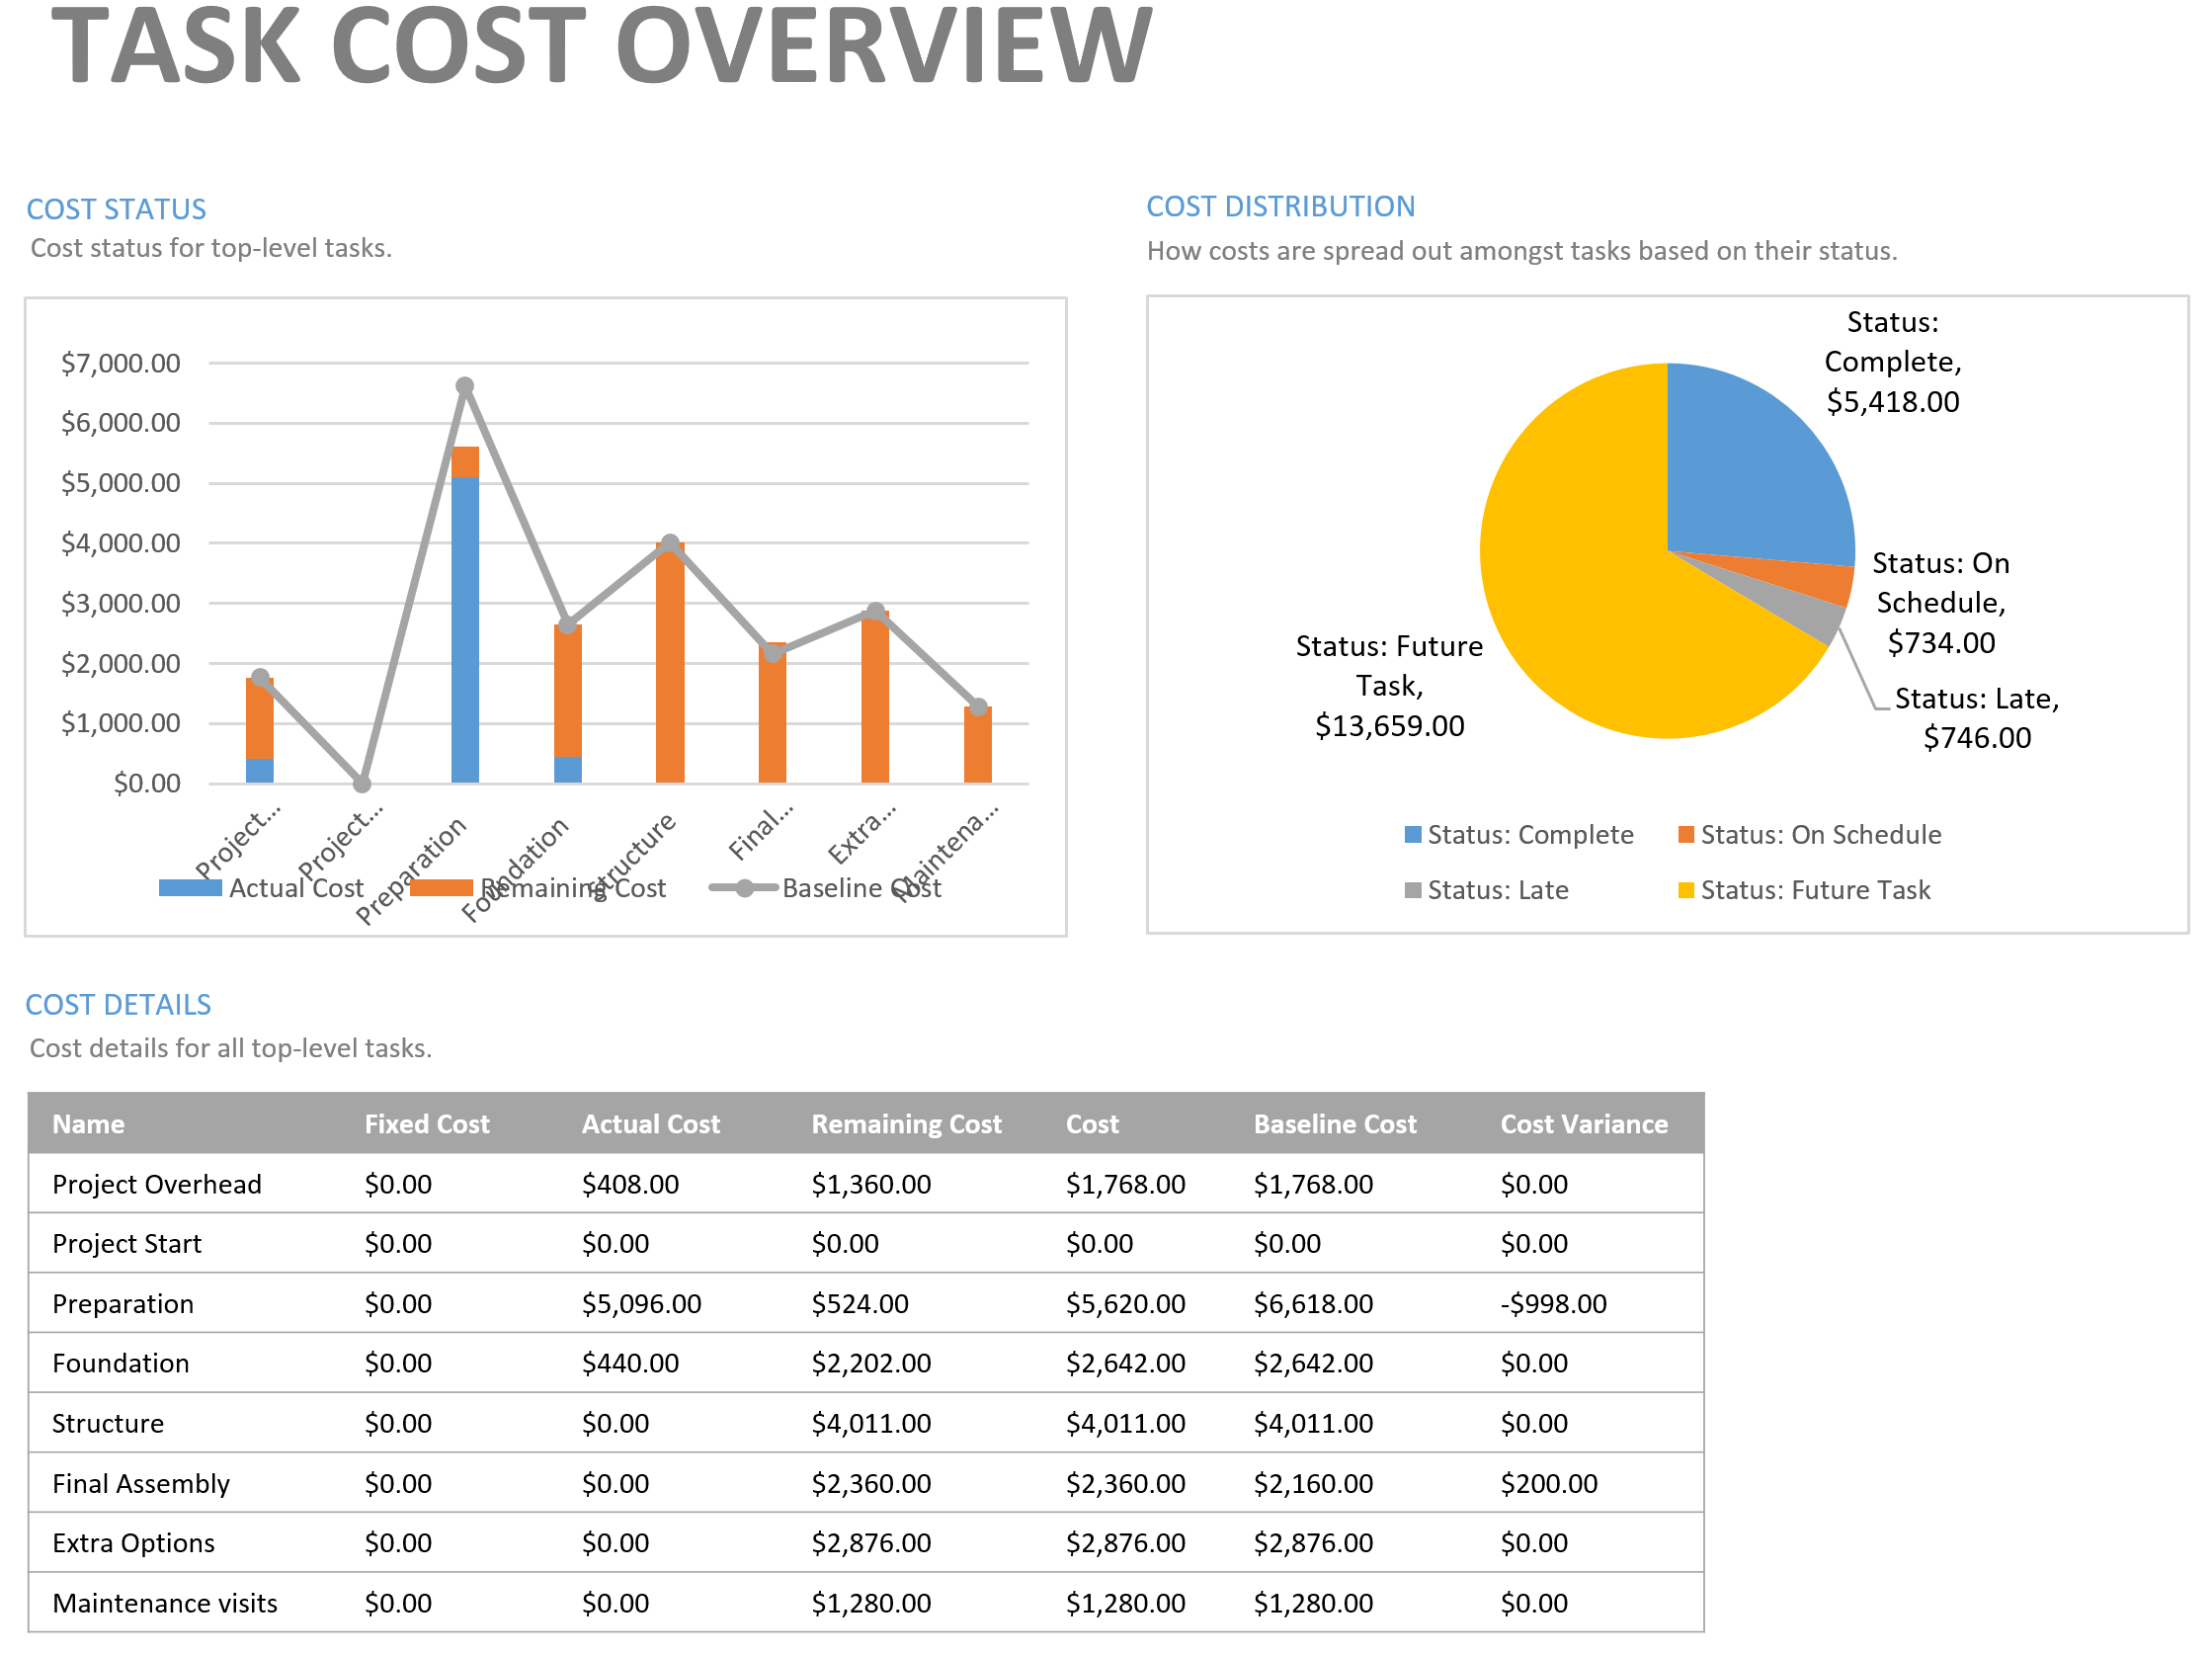
The Task Cost Overview also shows 3 areas
This time with information about the cost of tasks in your project:
The Cost Status chart is a combination chart that shows the Actual Cost and Remaining Cost in stacked columns for each top-level task as well as a line for Baseline Cost.
The Cost Distribution chart shows how costs are spread out amongst tasks based on the Status field: complete, on schedule, late and future task.
- Complete: The task is 100 percent complete
- Future task: Start date is greater than the Status Date
- On Schedule: The timephased cumulative percent complete is spread to at least the day before the Status Date
- Late task: The timephased cumulative percent complete does not reach midnight on the day before the Status Date
In the example you can see that the biggest chunk of costs is for future tasks.
The Cost Details table shows for each top-level task of your project the Fixed Cost, Actual Cost, Remaining Cost, Cost, Baseline Cost and Cost Variance (Cost = Actual Cost + Remaining Cost; Cost Variance = Cost - Baseline Cost). Also in this table you can cleary see that the final assembly costs $200.- more than baselined.
Standard cost reports in MS Project
We are very enthusiastic about these standard reports in MS Project; what about you?
Leave it in the comments below.