Cost overview report in MS Project
The Cost Overview Report in MS Project shows four areas with cost information about your project.
[divider]
[action_call text=”Microsoft Project Introduction Course” button_url=”https://members.ms-project-elearning.com/vsl-order-form” button_text=”Purchase Now for only 0.99 USD”]
[divider]
The upper left corner of the report shows the Forecasted Cost (‘Cost’); this is the actual cost + the remaining cost for the entire project. It also shows the Remaining Cost separately as well as the % complete of the project. Note that this percentage refers to the duration that has past. It does not say anything about the work that has been done, actual cost being incurred or the actual physical product being finished.
Progress versus cost chart
The Progress Versus Cost chart shows if your project is over budget or not. If the blue line is below the orange line, your project may be over budget.
Cost status table
The Cost Status table shows you the Actual Cost, Remaining Cost, Baseline Cost, Cost and Cost Variance for every top-level task (outline level 1). These are your main deliverables in this case. Here we can see for example that the final assembly cost $200,- more (the fixed price painting job) and the preparation cost $ 998 less than we have baselined (cheaper building package and less required man hours).
Cost status chart
The Cost Status chart is a combination chart that show the Actual Cost and Remaining Cost in stacked columns for each top-level task as well as a line for Baseline Cost. In the example it is clearly visible that the preparation costs less than the baseline cost (Actual Cost + Remaining Cost vs Baseline Cost), and that the preparation is almost entirely finished.

Your report?
Do you make use of the cost overview reports or do you prefer another tool (Excel)?
Share it in the comments below.
[divider]
[action_call text=”Microsoft Project Introduction Course” button_url=”https://members.ms-project-elearning.com/vsl-order-form” button_text=”Purchase Now for only 0.99 USD”]
[divider]
Resource usage vs. budget
How the costs of the resources evolve (actual cost plus remaining cost) can be tracked using our custom view ‘Resource Usage vs Budget’. In this view, which you will only find in the template, you can see how your project’s resources are using the budget, per Budget Name (hours and materials):

[divider]
[action_call text=”Microsoft Project Introduction Course” button_url=”https://members.ms-project-elearning.com/vsl-order-form” button_text=”Purchase Now for only 0.99 USD”]
[divider]
Get the view and template
Note that this view shows how the use of resources have impact on the budget, for instance work, material and cost resources. There is one cost type that will not be included in this view, which is the fixed cost you have entered on the task level such as outsourced work. The highlight report will show you all the costs against the total budget, that is per main deliverable. (Note: The highlight report also comes with the template in our e-courses!)
What do you think of this custom view in MS Project? Please leave a comment below.
Compare costs to the budget
With our custom view ‘Cost vs Budget‘ you can learn from your actual costs against budget. Note that we only have a budget on the Project Summary task, so for that reason only this task is displayed in this view.
[divider]
[action_call text=”Microsoft Project Introduction Course” button_url=”https://members.ms-project-elearning.com/vsl-order-form” button_text=”Purchase Now for only 0.99 USD”]
[divider]
Of course you could expand the Project Summary task, so Summary tasks and tasks will become visible. This way you can see how your budget is or will be spent.

Here, the meaning of the possible indicators is slightly different. Our notion is that in terms of comparison against budget, spending less is always considered to be good.
Smileys
- Green smiley = value has not changed, or has decreased (under budget)
- Amber smiley = value has increased, but not more than 10%
- Red smiley = value has increased by more than 10%
Of course, we still think that if you foresee to spend considerably less than budgeted, this should be communicated so the budget could be freed up and other projects could be started (earlier).
What about you?
Where do you struggle the most when it comes to your budget in MS Project?
[divider]
[action_call text=”Microsoft Project Introduction Course” button_url=”https://members.ms-project-elearning.com/vsl-order-form” button_text=”Purchase Now for only 0.99 USD”]
[divider]
Cost management
Many, many times we see that project timing and project resourcing are managed in MS Project, while project finances are kept in Excel. Using the financial governance capacilities in MS Project is often an unexploited area. This is a waste, because only adding rates to resources will already bring you half way. MS Project can calculate anything for you directly from your schedule.
[divider]
[action_call text=”Microsoft Project Introduction Course” button_url=”https://members.ms-project-elearning.com/vsl-order-form” button_text=”Purchase Now for only 0.99 USD”]
[divider]
The trick here is also to keep the right balance between the amount of input and getting valuable output. Remember MS Project is not meant to be accounting software, MS Project is a modeling tool which should deliberately simplify the reality. Accountants cannot permit to simplify. Neither will it serve as an invoicing system.
What will we do in cost management (part of our Pro course)?
In the e-course ‘cost management’ you will enter a project budget for main cost types, compare planned cost against actual cost. Predict eventual cost at project complete based on actual progress, provide burn-down charts and earned value metrics to qualify the project’s performance. All the things required to be able to perform quality cost control.
In “Cost Management” (Pro course) we will teach you how to set up a financial governance way of work, that builds on what you already have in your schedule in MS Project.
How are you dealing with costs in your current schedule? Share your experience in the comments below!
[divider]
[action_call text=”Microsoft Project Introduction Course” button_url=”https://members.ms-project-elearning.com/vsl-order-form” button_text=”Purchase Now for only 0.99 USD”]
[divider]
Using the earned value management report
In the reports tab, you find the earned value management report. We think this is very important and above all, very much appreciated by your manager. We also made it part of the Highlight Report you can find in our e-course Cost Management (Pro course).
[divider]
[action_call text=”Microsoft Project Introduction Course” button_url=”https://members.ms-project-elearning.com/vsl-order-form” button_text=”Purchase Now for only 0.99 USD”]
[divider]
The new term EAC is also explained here. This stands for the Estimate At Completion. In other words, if we extrapolate the current progress against the baseline to the end of the project, this will be the total costs of the project (16-17 days for ten paintings at my hourly rate).

Earned Value over Time
The graph Earned Value over Time shows the earned value of the project based on the status date.
- If the actual costs (ACWP = blue) are higher than the earned value (BCWP = orange), the project budget has been exceeded. For example, I have painted three paintings for a higher hourly rate.
- If the scheduled value (BCWS = gray) is higher than the earned value (orange), the project is behind schedule. For example, I have finished less paintings than I expected to have on this (status) date.

Variance over time
The graph Variance over time shows costs and efficiency variances for the project based on the status date.
- If CV (cost variance, the price difference) is negative, the project is exceeding budget. For example, I have painted three paintings for a higher hourly rate.
- If SV (schedule variance, the efficiency difference) is positive, the project is behind schedule. For example, I have finished less paintings than I expected to have on this (status) date.

Indices over time
The graph Indices over time shows the performance index for cost and schedule based on the status date. The greater the performance index, the better the project is on schedule (SPI) and the more costs are saved (CPI).

So what do you need to get these amazing reports?
Let us consider the following example:
I have to make ten paintings (scope) in ten days (duration). We sell them at $100.- each (cost information). At the end of day 5 (status date) I finished only 3 paintings (progress information).
What do you need in our schedule?
- Baseline scope and duration: ten paintings in ten days
- Cost Information: Selling price of $100.- each
- Status Date
- Progress information: Marking tasks complete
Do you use or do you consider using earned value management techniques in your MS Project schedule?
Share it in the comments below.
[divider]
[action_call text=”Microsoft Project Introduction Course” button_url=”https://members.ms-project-elearning.com/vsl-order-form” button_text=”Purchase Now for only 0.99 USD”]
[divider]
Analyzing variances of task and resource costs in MS Project
With the report Cost Overruns (tab reports > custom > cost overruns) you can easily see the changes (compared to the baseline) and which tasks or resources became more expensive or cheaper.
[divider]
[action_call text=”Microsoft Project Introduction Course” button_url=”https://members.ms-project-elearning.com/vsl-order-form” button_text=”Purchase Now for only 0.99 USD”]
[divider]
The task cost variance chart
The report contains two charts and two tables. The Task Cost Variance chart is a line chart that shows the cost variance for every top-level tasks of your project. Directly below the chart you see a table with the % complete and current cost data for the same top-level tasks as in the chart. The chart is a great visualization of the table below; it’s clearly visible that the task ‘preparation’ costs less than baselined (-$998).
The resource cost variance chart
The Resource Cost Variance chart is a bar chart that shows the Cost Variance for every work and cost resource in your project. (Cost Variance = Cost – Baseline Cost). You easily spot here that (work) resource Edwin is a little over $300.- cheaper than baselined. In the table directly below you can see the Cost, Baseline Cost and Cost Variance for every work resource.

What’s your opinion
What do you think of the cost management functionality in MS Project 2013/2016?
Share your opinion in the comments below.
[divider]
[action_call text=”Microsoft Project Introduction Course” button_url=”https://members.ms-project-elearning.com/vsl-order-form” button_text=”Purchase Now for only 0.99 USD”]
[divider]
How to use the cashflow report in MS Project?
With the report ‘Cashflow‘ you can see the progress of the project costs compared to the baseline. Also, three Earned Value Management metrics are introduced here:
- ACWP stands for actual costs work performed. This is the same as actual Cost.
- BCWS means budgeted cost work scheduled (according to the baseline). In other words: these are the actual costs we would have at this point in time, when we would exactly progressed according to the baseline schedule.
- BCWP stands for the budgeted cost work performed, in other words: what did we expect to pay for the actual work that has been progressed at this point in time.
[divider]
[action_call text=”Microsoft Project Introduction Course” button_url=”https://members.ms-project-elearning.com/vsl-order-form” button_text=”Purchase Now for only 0.99 USD”]
[divider]

Again, the table shows only the top-level tasks. If you want to drill down, click the table, and in the right menu select the outline level you want:

Earned value for your project
Do you consider using this report in MS Project? What would be the biggest benefit for you?
Leave it in the comments below.
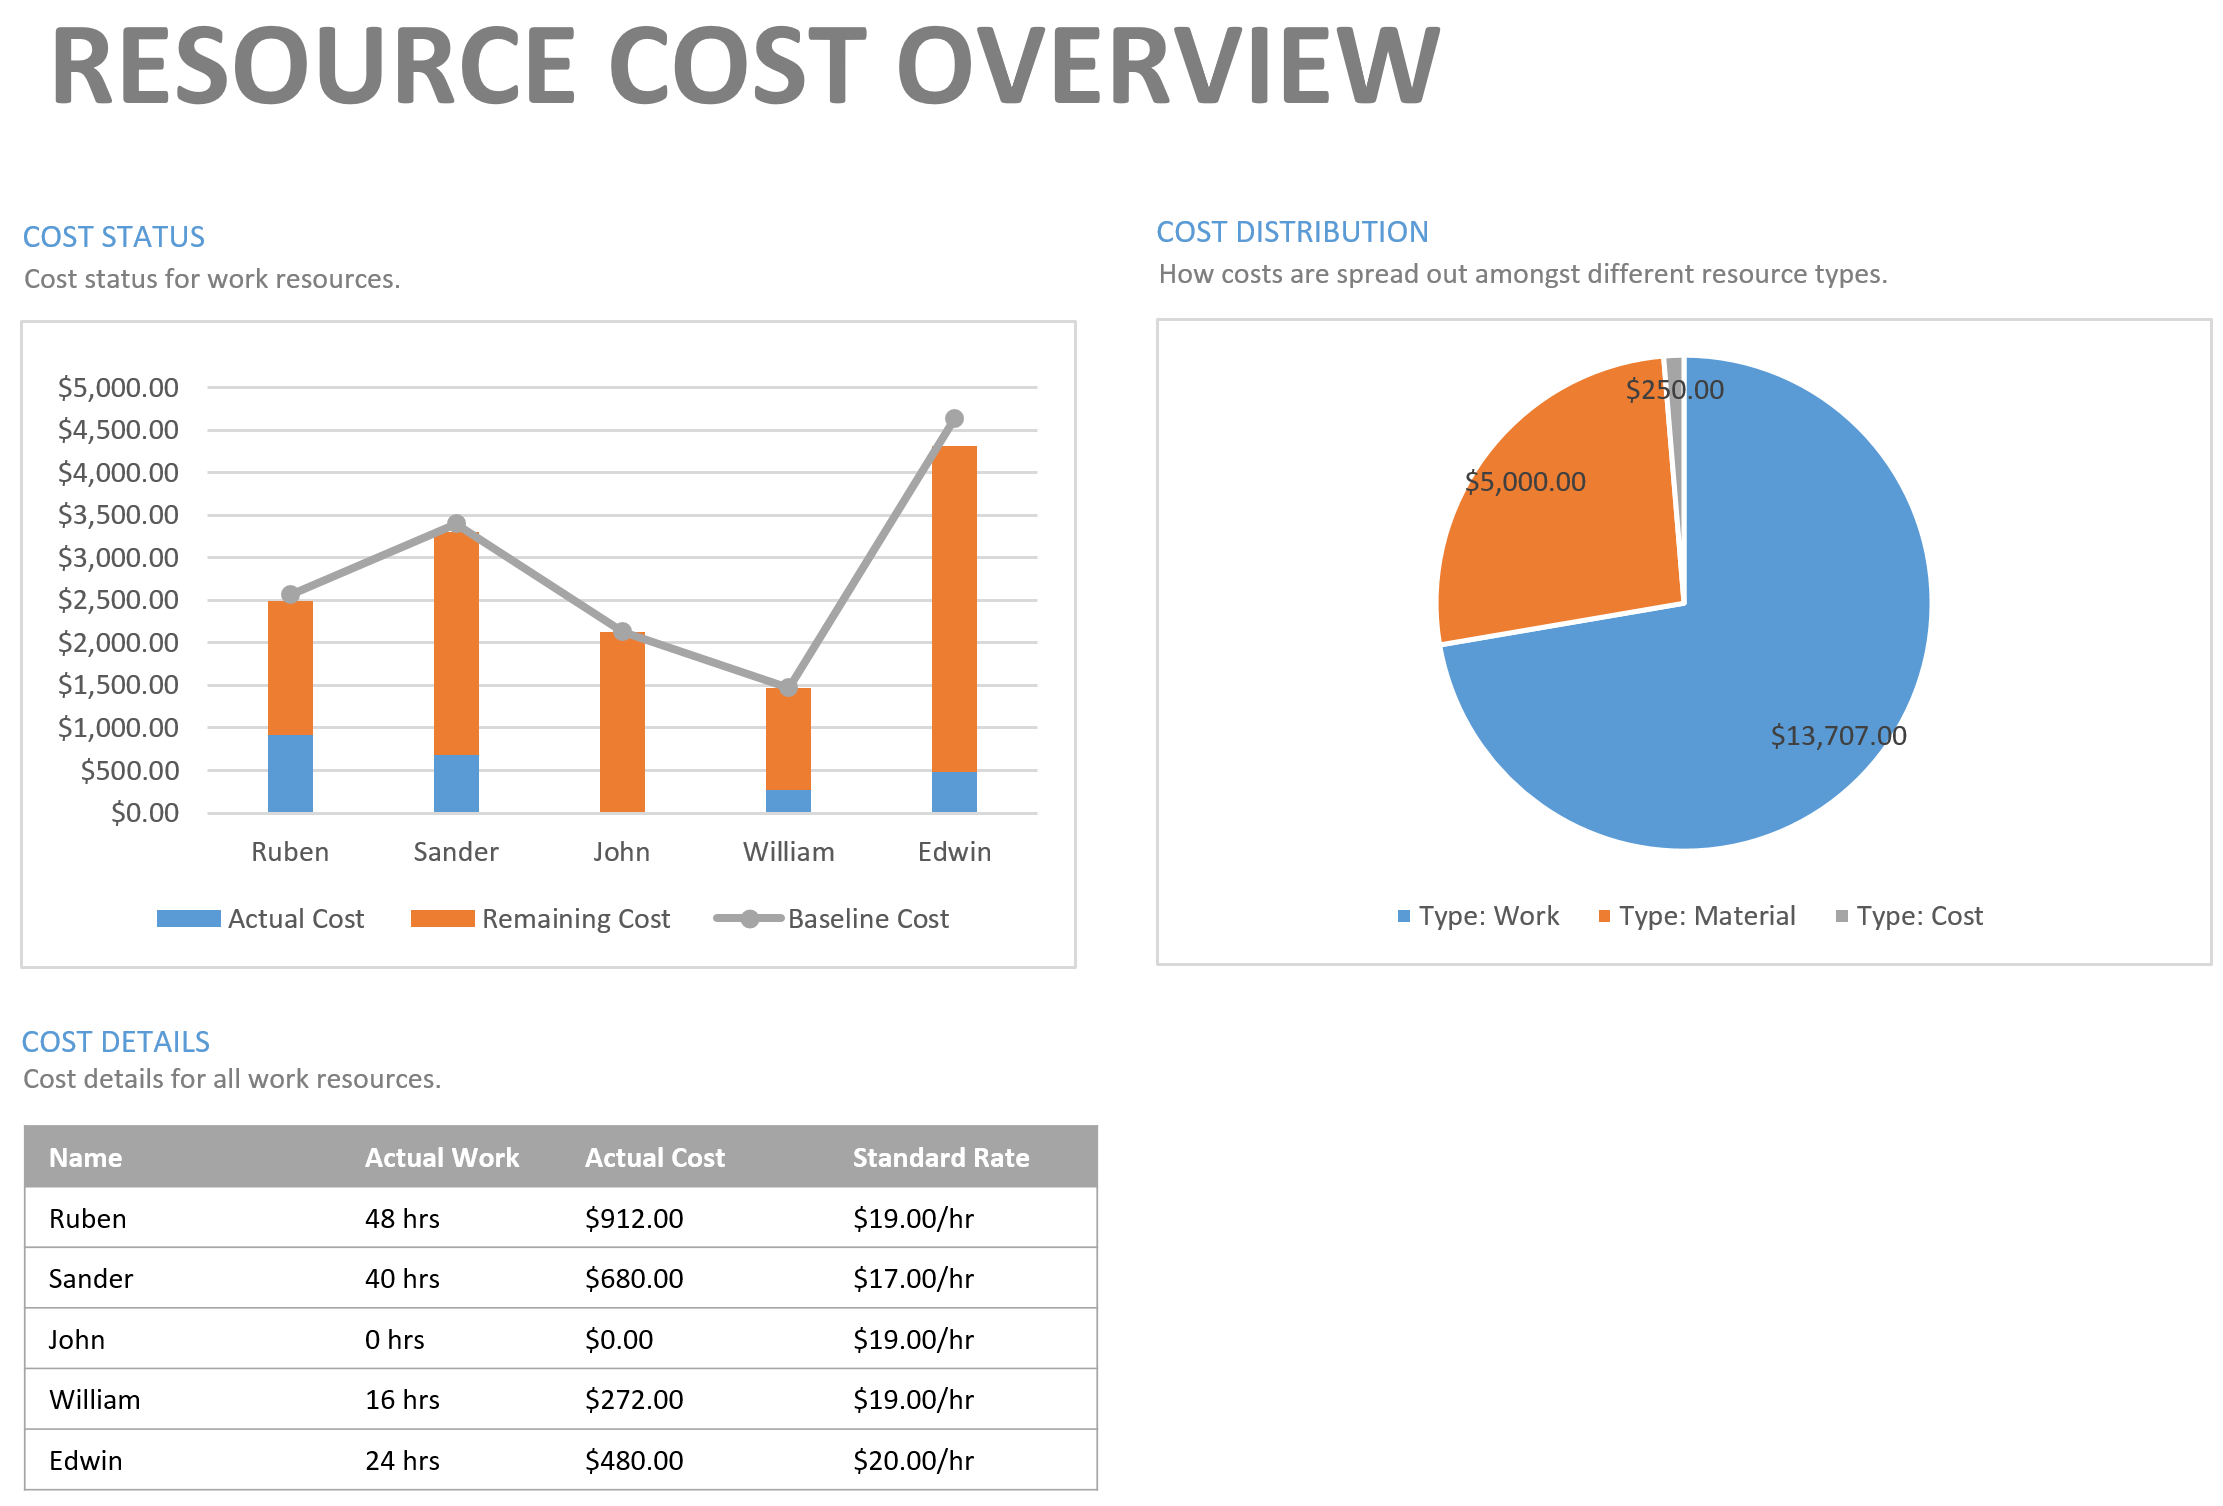
The standard reports ‘Resource Cost Overview‘ and ‘Task Cost Overview’ provide useful graphs and a clear overview of the costs of the work in progress.
[divider]
[action_call text=”Microsoft Project Introduction Course” button_url=”https://members.ms-project-elearning.com/vsl-order-form” button_text=”Purchase Now for only 0.99 USD”]
[divider]
To open the reports click:
- Tab ‘Report’
- Select from the dropdown menu ‘Costs’
- Resource Cost Overview & Task Cost Overview
3 areas with information about the cost of resources in your project
The Cost Status chart is a combination chart that displays the Actual Cost and Remaining Cost per (work) resource in stacked columns, as well as a line for Baseline Cost. You can see in the example that the resource Edwin is expected to cost the most, but that he costs less than the baseline cost. The reason for this could be a lower rate, less hours or a combination of both.
The Cost Distribution pie-chart shows how cost are spread out amongst different resource types (work, material, cost).
The Cost Details table shows for each (work) resource in your project team the Actual Work, Actual Cost and Standard Rate (Actual Cost = Actual Work x Standard Rate).
The Task Cost Overview also shows 3 areas
This time with information about the cost of tasks in your project:
The Cost Status chart is a combination chart that shows the Actual Cost and Remaining Cost in stacked columns for each top-level task as well as a line for Baseline Cost.
The Cost Distribution chart shows how costs are spread out amongst tasks based on the Status field: complete, on schedule, late and future task.
- Complete: The task is 100 percent complete
- Future task: Start date is greater than the Status Date
- On Schedule: The timephased cumulative percent complete is spread to at least the day before the Status Date
- Late task: The timephased cumulative percent complete does not reach midnight on the day before the Status Date
In the example you can see that the biggest chunk of costs is for future tasks.
The Cost Details table shows for each top-level task of your project the Fixed Cost, Actual Cost, Remaining Cost, Cost, Baseline Cost and Cost Variance (Cost = Actual Cost + Remaining Cost; Cost Variance = Cost – Baseline Cost). Also in this table you can cleary see that the final assembly costs $200.- more than baselined.

Standard cost reports in MS Project
We are very enthusiastic about these standard reports in MS Project; what about you?
Leave it in the comments below.
[divider]
[action_call text=”Microsoft Project Introduction Course” button_url=”https://members.ms-project-elearning.com/vsl-order-form” button_text=”Purchase Now for only 0.99 USD”]
[divider]
How is the baseline used for cost tracking? In the reports, you will find two types of cost information; absolute and relative to either:
- The situation how it was once projected: The Baseline
- The current phase in the project: The Status date
Just like any other information on tasks and assignments, cost information is also stored when saving the baseline. Correct baseline use is therefore one of the most important prerequisites for using valuable and valid cost reports.
[divider]
[action_call text=”Microsoft Project Introduction Course” button_url=”https://members.ms-project-elearning.com/vsl-order-form” button_text=”Purchase Now for only 0.99 USD”]
[divider]
A quick recap
The baseline is set through the Project tab > Set Baseline > Set Baseline > select the correct Baseline > OK. The baseline should be set only once all relevant parties agree on the schedule, including the cost projections. Typically, the first time the baseline is set, is once the Project Initiation Document (PID) has been approved. Also, we recommend you to ask for an acknowledgement from these parties that the right situation is now baselined. You want to take every chance to avoid miscommunication and debate at a later stage, for instance when you show your (cost) report that lays out actuals against this baseline.

Cost tracking in your organization
Is the baseline used for cost tracking in your organization? If not, what is blocking you?
Start a discussion in the comments below.
The Status date
The status date – what was it again? It is the date until which you have updated your schedule. Consider these situations:

[divider]
[action_call text=”Microsoft Project Introduction Course” button_url=”https://members.ms-project-elearning.com/vsl-order-form” button_text=”Purchase Now for only 0.99 USD”]
[divider]
Take a look
In this situation, I have updated my schedule at the end of day 5 and I have stated to have my task for 50% complete. I am working according to plan.

What changed?
Now, I have updated my schedule at the end of day 8 and I have stated to have my task for 50% complete. I am far behind schedule and need to catch up three days.

And now?
In the last example, I have updated my schedule at the end of day 3 and I have stated to have my task for 50% complete. I am far ahead of schedule. Even more, if I keep working at this speed, I will probably not need the total ten days, but only six days.
What does that mean?
These three examples illustrate that it is important to keep updating your status date, as this will determine how your progress is perceived and interpreted through your cost reports. The status date is especially important for the s-curves in the earned value management reports, which we will fully discuss in our e-course Cost Management (Pro course).
Tips & Tricks
Do you have any tips for other MS Project users about the status date?
Leave it in the comments below.
[divider]
[action_call text=”Microsoft Project Introduction Course” button_url=”https://members.ms-project-elearning.com/vsl-order-form” button_text=”Purchase Now for only 0.99 USD”]
[divider]