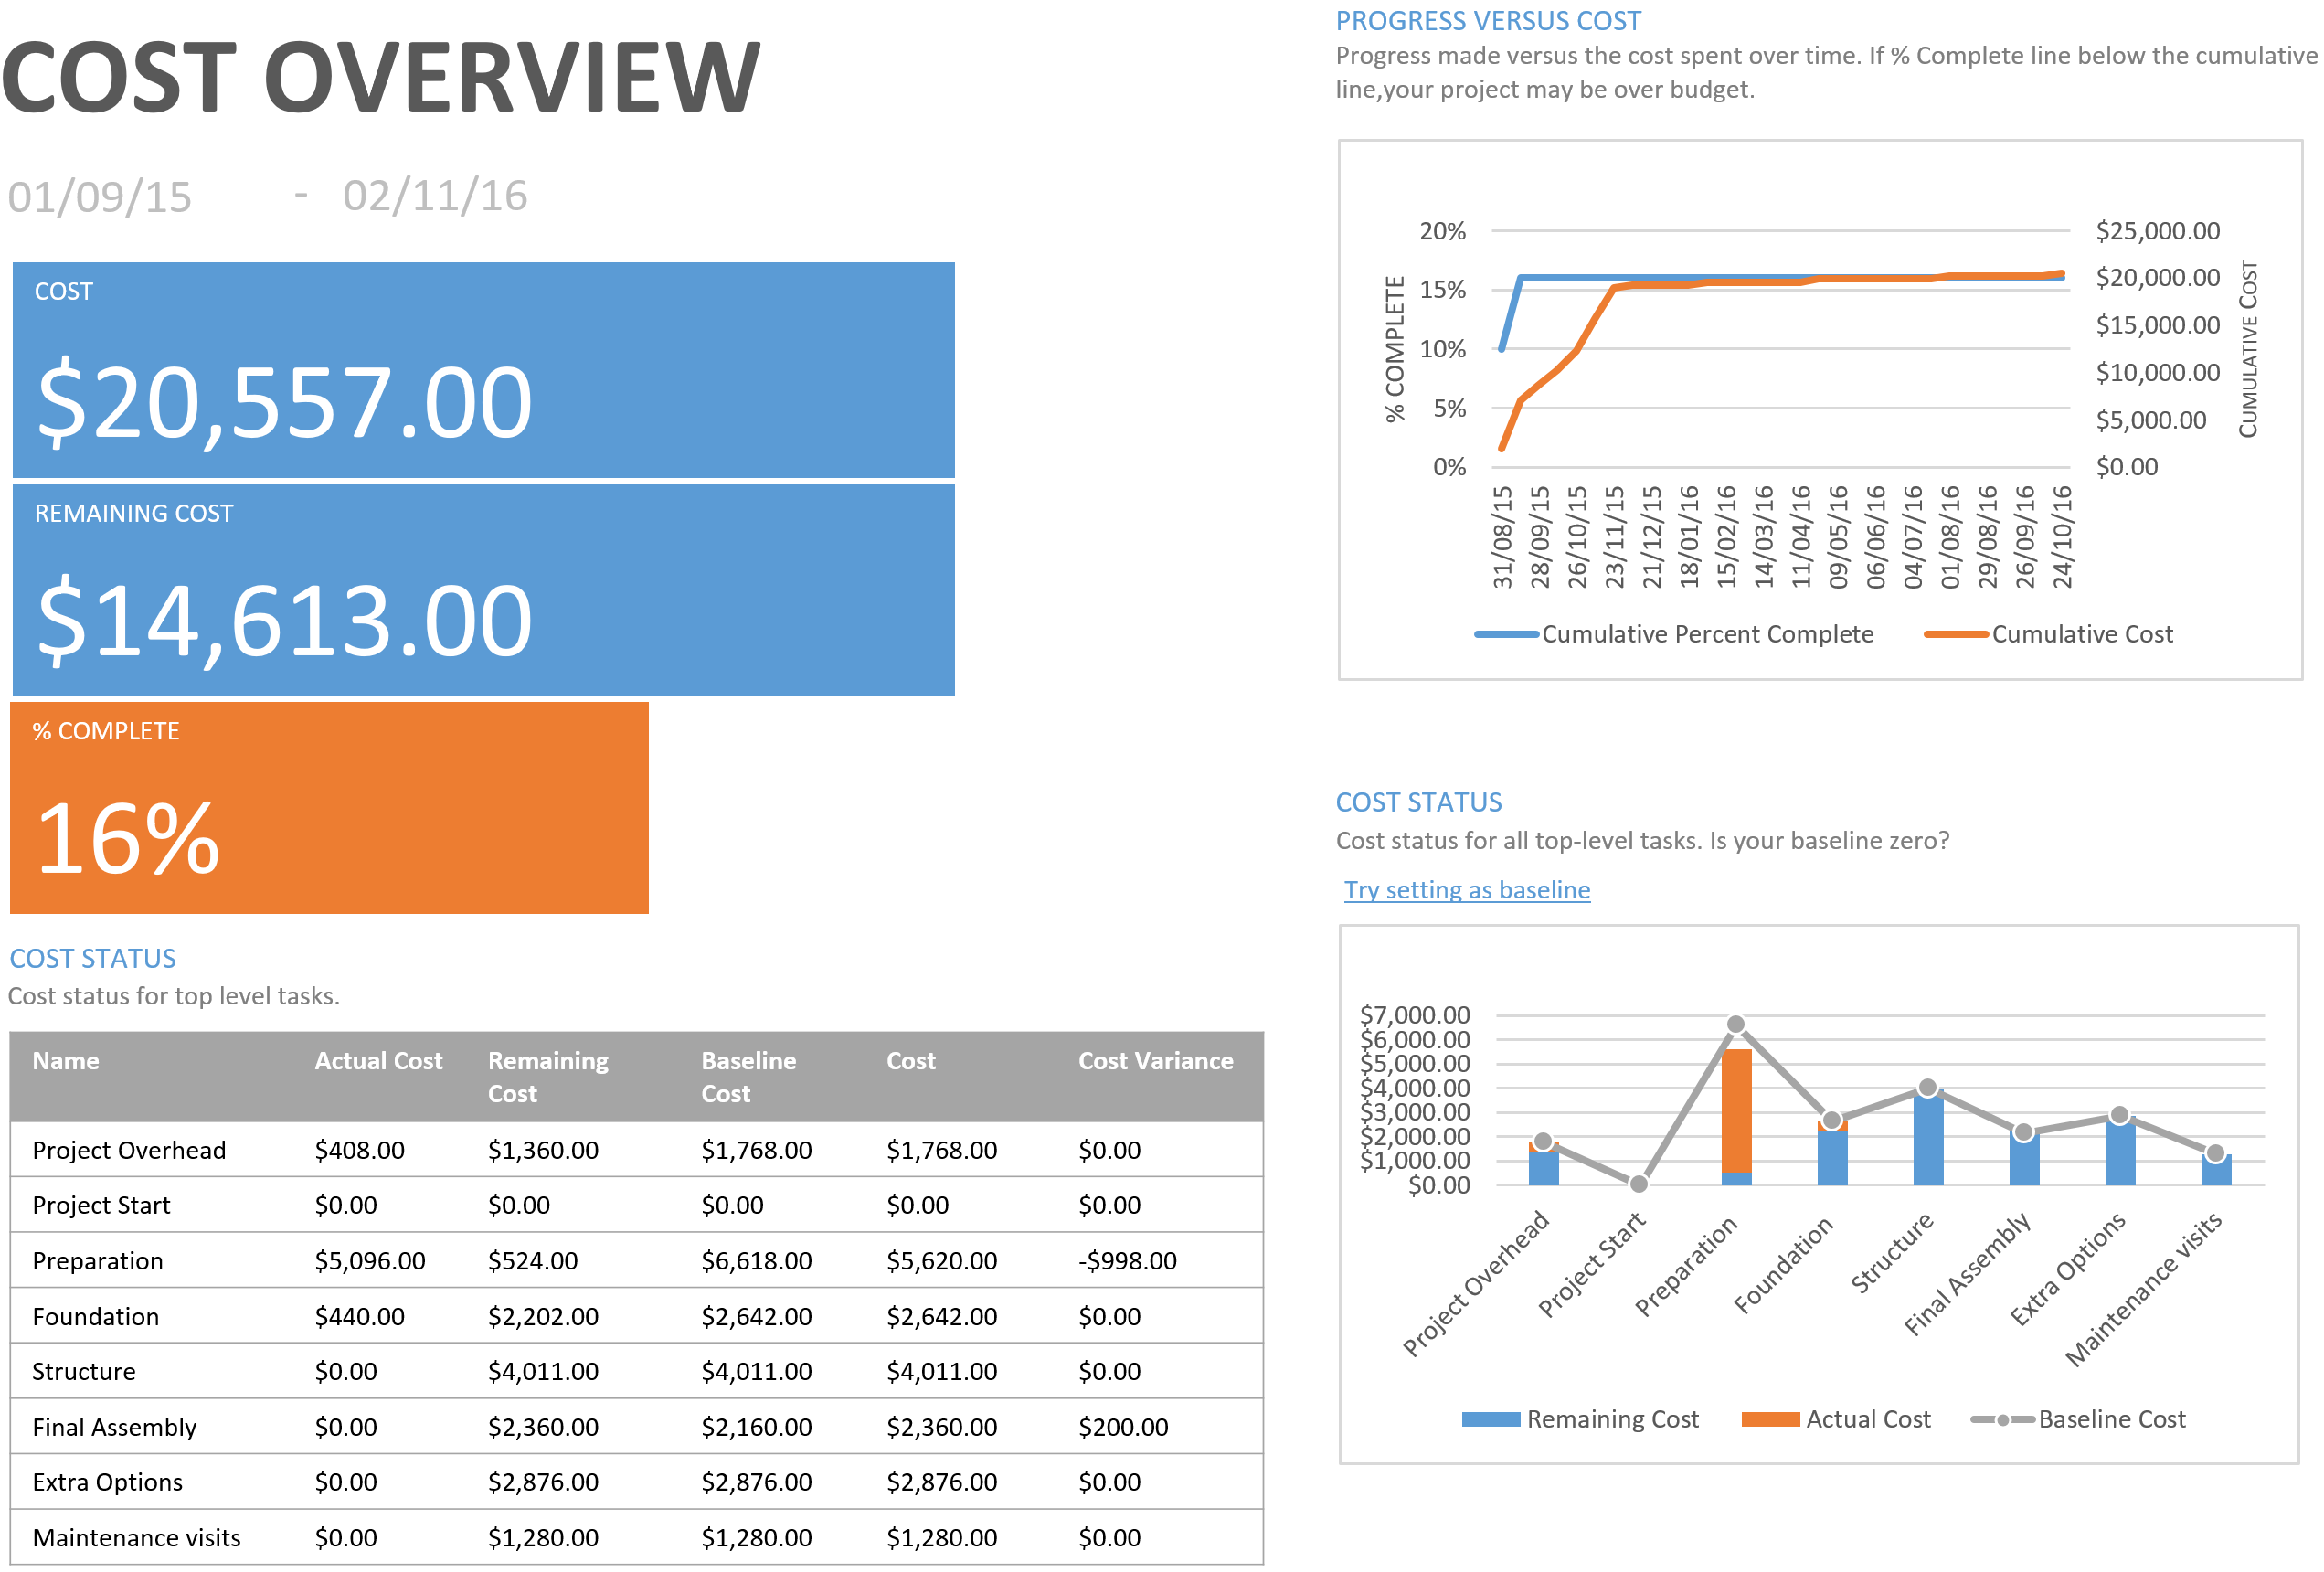
Cost overview report in MS Project
The Cost Overview Report in MS Project shows four areas with cost information about your project.
The upper left corner of the report shows the Forecasted Cost ('Cost'); this is the actual cost + the remaining cost for the entire project. It also shows the Remaining Cost separately as well as the % complete of the project. Note that this percentage refers to the duration that has past. It does not say anything about the work that has been done, actual cost being incurred or the actual physical product being finished.

Progress versus cost chart
The Progress Versus Cost chart shows if your project is over budget or not. If the blue line is below the orange line, your project may be over budget.Cost status table
The Cost Status table shows you the Actual Cost, Remaining Cost, Baseline Cost, Cost and Cost Variance for every top-level task (outline level 1). These are your main deliverables in this case. Here we can see for example that the final assembly cost $200,- more (the fixed price painting job) and the preparation cost $ 998 less than we have baselined (cheaper building package and less required man hours).Cost status chart
The Cost Status chart is a combination chart that show the Actual Cost and Remaining Cost in stacked columns for each top-level task as well as a line for Baseline Cost. In the example it is clearly visible that the preparation costs less than the baseline cost (Actual Cost + Remaining Cost vs Baseline Cost), and that the preparation is almost entirely finished.
